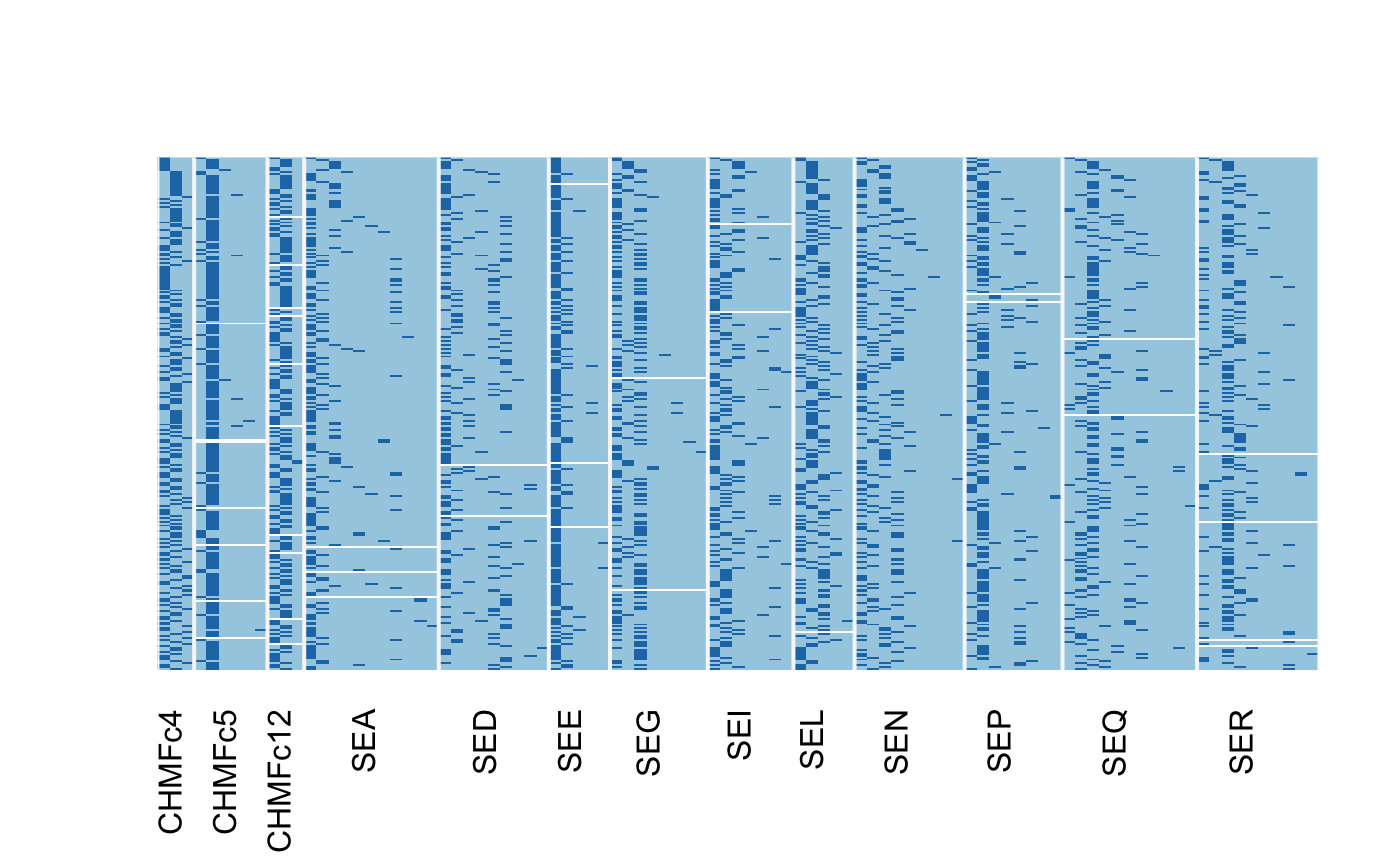
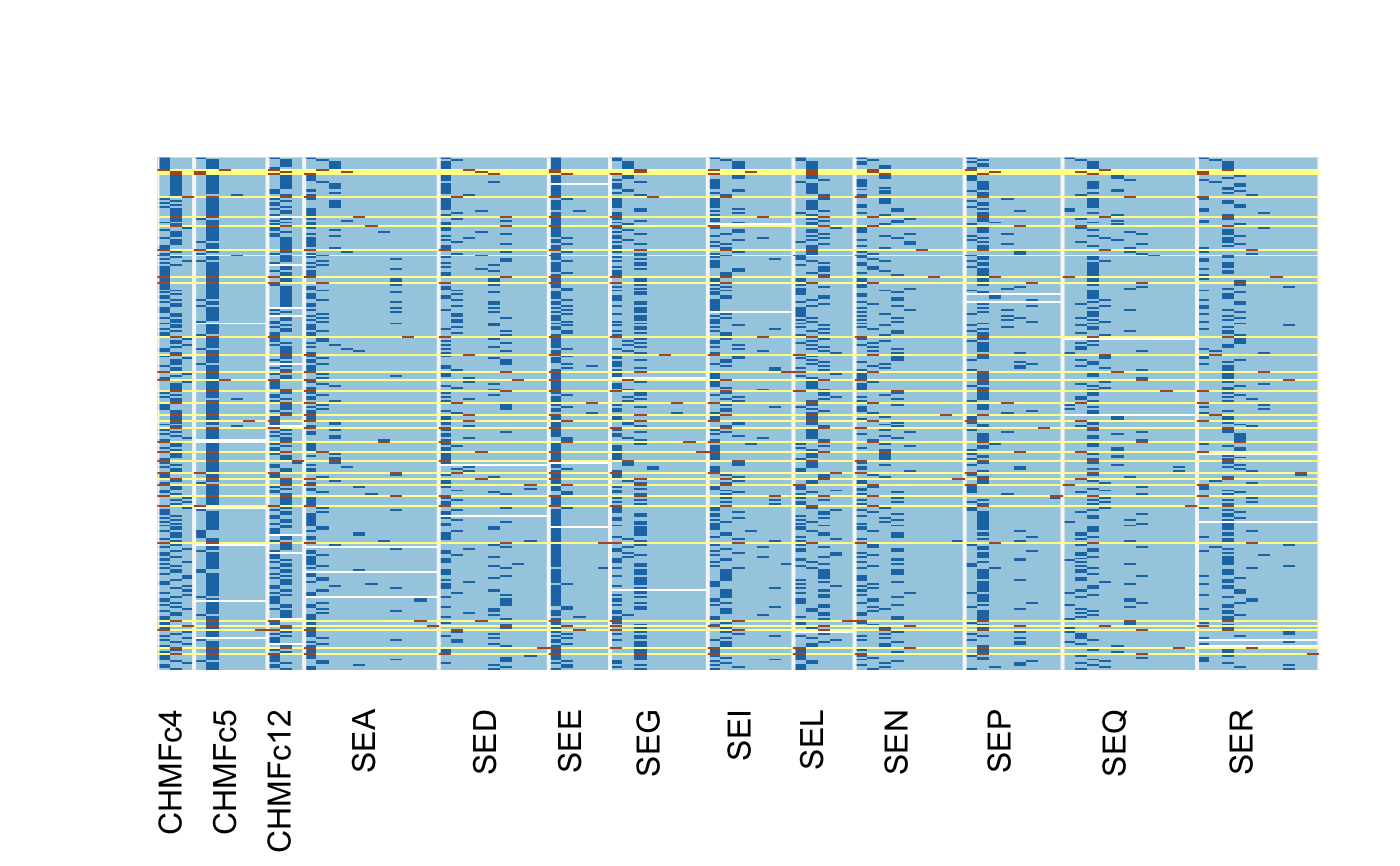
Create an image of the data matrix
rpv_image.Rd
Create an image of the data matrix
rpv_image(tab, f = NULL, highlight = NULL, newplot = TRUE,
  col = c("#A6CEE3", "#1F78B4"), idcol = c("#FFFF99", "#B15928"))
Arguments
| tab | a numeric matrix |
|---|---|
| f | a factor that is the same length as the number of columns in |
| highlight | a character vector specifing which row names or indices to highlight. |
| newplot | When |
| col | a two-color vector for the values of the matrix. |
| idcol | a two-color vector for the highlight values. |
Value
NULL, invisibly
Details
This function creates a plot that will allow you to visualize a matrix, optionally overlaying data. Note: the values here represent the presence/absence of a variable, but does not represent the dosage.
Examples
data(monilinia) loci <- sapply(strsplit(colnames(monilinia), "[.]"), "[", 1) rpv_image(monilinia, f = loci)