Recreating Figure 3
7 min readMotivation
In February of 2016, I got an email asking if I could provide the code to recreate figure three from my article in Phytopathology on the outbreak of Phytophthora ramorum in Curry County OR from 2001 to 2014 (paywalled, but you can find a copy here).
While I have the code used for the analysis on github, it’s a lot of stuff to sort through, considering that it was my first foray in attempting a reproducible analysis, so for this post, I’m going to recreate it using current tools.
I created figure three originally in two parts with ggplot2 and then manually aligned the two figures in inkscape. Since then, the package cowplot has come around and made this process easier. I have my old code up here: mlg_distribution.Rmd, and since the packages have changed since then, I’m redoing the code here.
Analysis
Loading Packages/Data
library("poppr") # Note, v.2.2.0 or greater is needed for the %>% operator## Loading required package: adegenet## Loading required package: ade4##
## /// adegenet 2.1.0 is loaded ////////////
##
## > overview: '?adegenet'
## > tutorials/doc/questions: 'adegenetWeb()'
## > bug reports/feature requests: adegenetIssues()## This is poppr version 2.5.0. To get started, type package?poppr
## OMP parallel support: availablelibrary("ggplot2") # Plotting
library("cowplot") # Grouping the plots##
## Attaching package: 'cowplot'## The following object is masked from 'package:ggplot2':
##
## ggsaveThe data from the paper has been stored in poppr as “Pram”, but it includes nursery data. I’m removing it here.
data("Pram")
mll(Pram) <- "original"
Pram
##
## This is a genclone object
## -------------------------
## Genotype information:
##
## 98 original multilocus genotypes
## 729 diploid individuals
## 5 codominant loci
##
## Population information:
##
## 3 strata - SOURCE, YEAR, STATE
## 9 populations defined -
## Nursery_CA, Nursery_OR, JHallCr_OR, ..., Winchuck_OR, ChetcoMain_OR, PistolRSF_ORramdat <- Pram %>%
setPop(~SOURCE) %>% # Set population strata to SOURCE (forest/nursery)
popsub(blacklist = "Nursery") %>% # remove the nursery derived samples
setPop(~YEAR) # Set the strata to YEAR of epidemic
# A color palette (unnecessary)
ncolors <- max(mll(ramdat))
myPal <- setNames(funky(ncolors), paste0("MLG.", seq(ncolors)))Creating the Barplot
The barplot is a barplot of the MLG counts ordered from most abundant to least abundant.
# This obtains a table of sorted MLG counts for adjusting the axes.
mlg_order <- table(mll(ramdat)) %>%
  sort() %>%
  data.frame(MLG = paste0("MLG.", names(.)), Count = unclass(.))

# Creating the bar plot
bars <- ggplot(mlg_order, aes(x = MLG, y = Count, fill = MLG)) +
  geom_bar(stat = "identity") +
  theme_classic() +
  scale_y_continuous(expand = c(0, 0), limits = c(0, 180)) +
  scale_fill_manual(values = myPal) +
  geom_text(aes(label = Count), size = 2.5, hjust = 0, fontface = "bold") +
  theme(axis.text.y = element_blank()) +
  theme(axis.ticks.y = element_blank()) +
  theme(legend.position = "none") +
  theme(text = element_text(family = "Helvetica")) +
  theme(axis.title.y = element_blank()) +
  # From the documentation for theme: top, right, bottom, left
  theme(plot.margin = unit(c(1, 1, 1, 0), "lines")) +
  scale_x_discrete(limits = mlg_order$MLG) +
  coord_flip()

bars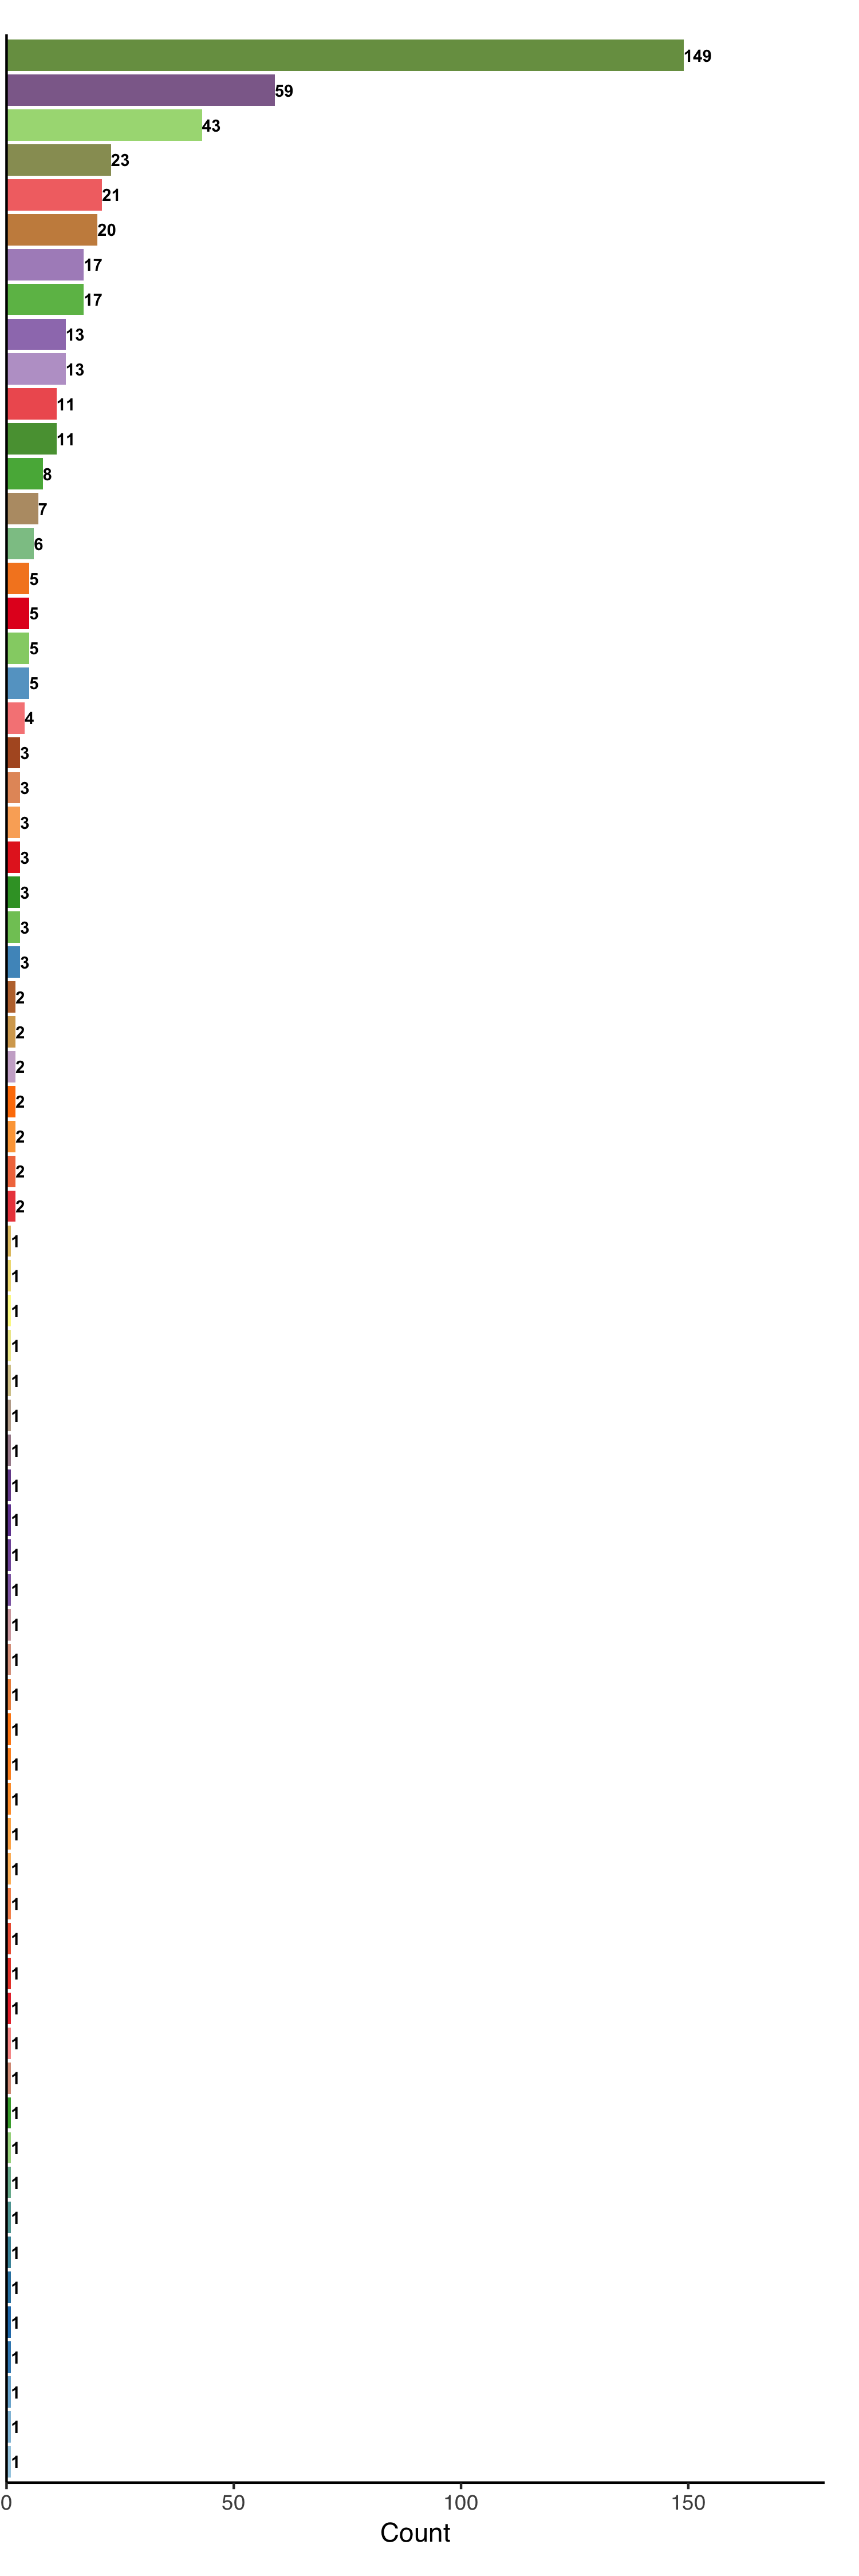
Creating the Subway plot
This plot displays the MLGs occurring across years. It’s a nice graphical way of displaying the results of mlg.crosspop() when the populations are years.
mlg_range <- mlg.crosspop(ramdat, mlgsub = unique(mll(ramdat)),
                          df = TRUE, quiet = TRUE)
names(mlg_range)[2] <- "Year"

# Creating the subway plot
ranges <- ggplot(mlg_range, aes(x = Year, y = MLG, group = MLG, color = MLG)) +
  geom_line(size = 1, linetype = 1) +
  geom_point(size = 5, pch = 21, fill = "white") +
  geom_text(aes(label = Count), color = "black", size = 2.5) +
  scale_color_manual(values = myPal) +
  ylab("Multilocus Genotype") +
  theme_bw() +
  theme(axis.text.x = element_text(angle = 90, hjust = 1, vjust = 0.5)) +
  theme(text = element_text(family = "Helvetica")) +
  theme(legend.position = "none") +
  theme(axis.line = element_line(colour = "black")) +
  # From the documentation for theme: top, right, bottom, left
  theme(plot.margin = unit(c(1, 0, 1, 1), "lines")) +
  scale_y_discrete(limits = mlg_order$MLG)

ranges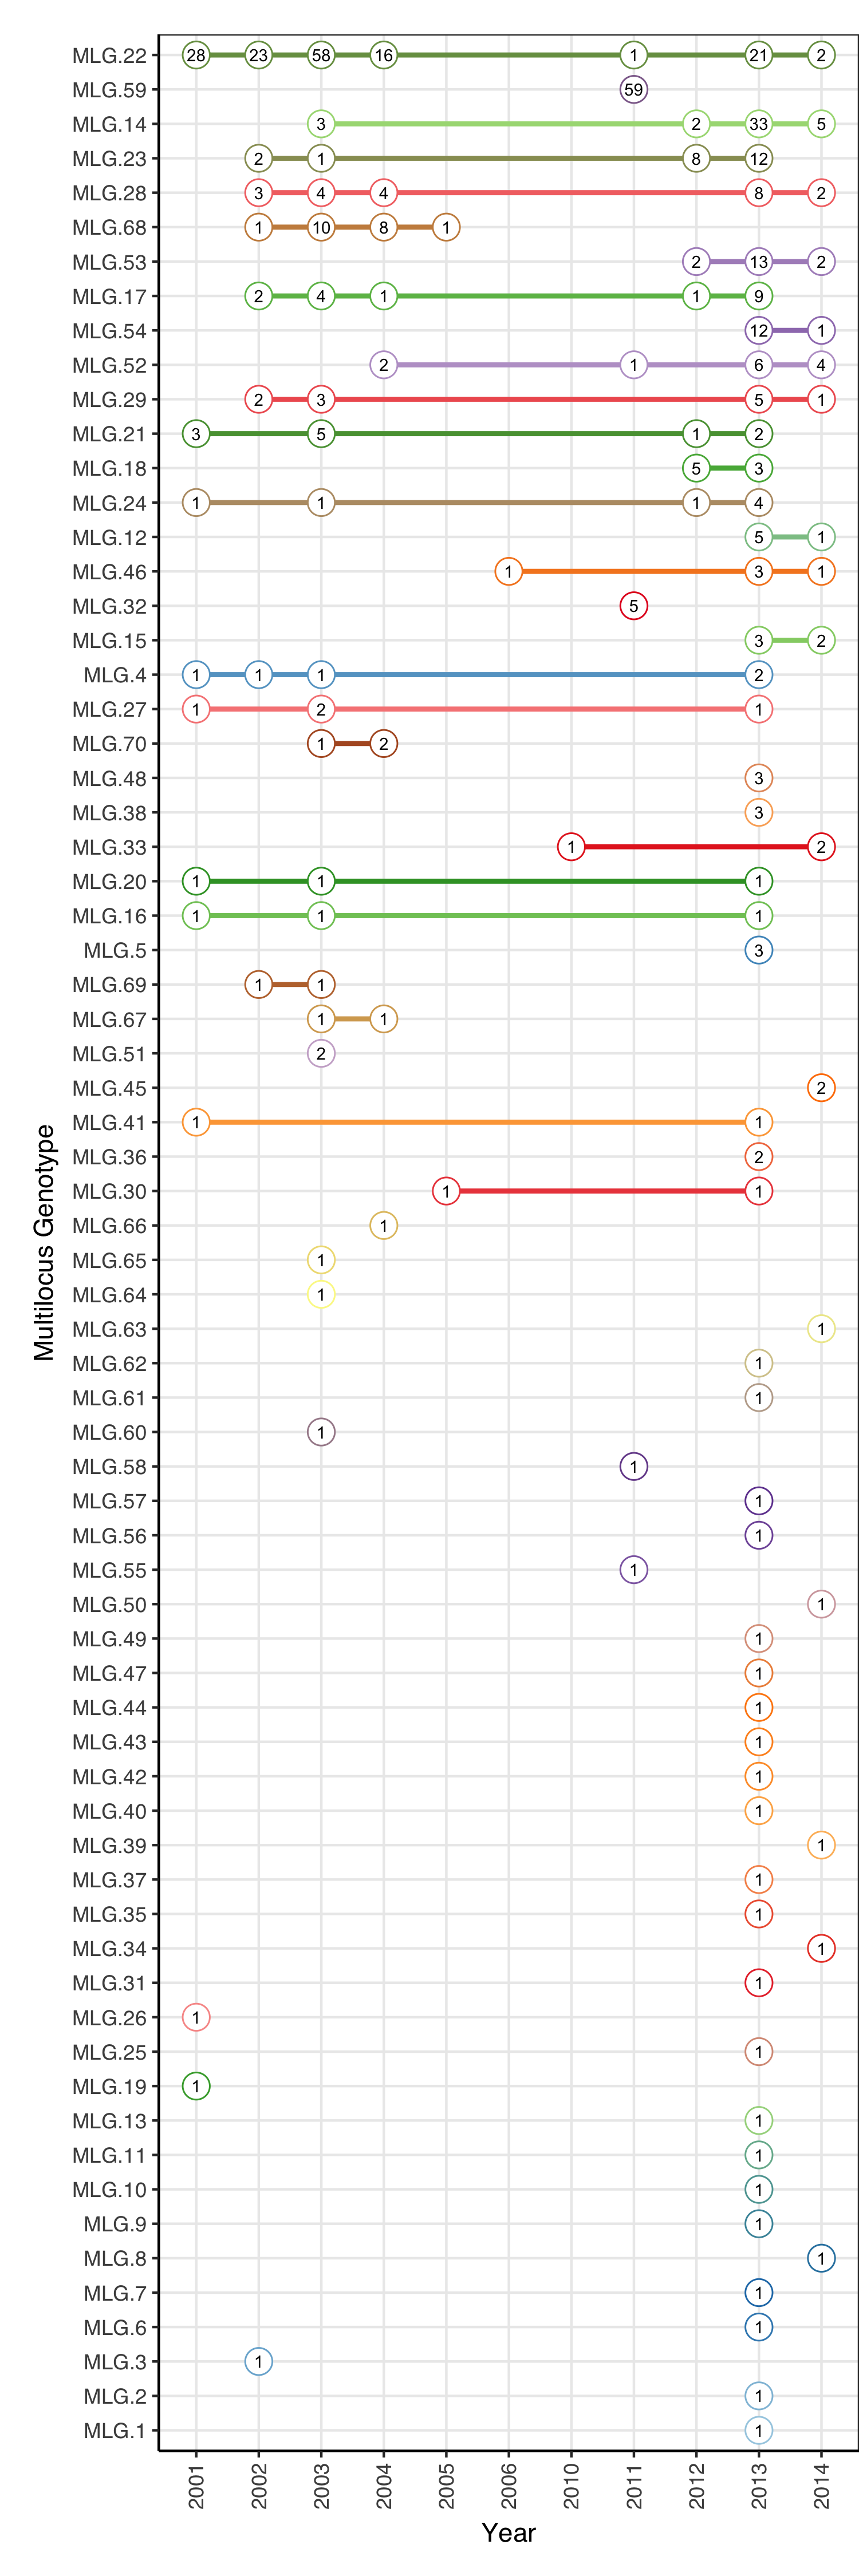
A word on margins
Cowplot is nice for placing the ggplot objects next to each other in one frame, but it likes to give them room to spread out. To get the plots as close together as possible, I’m cutting out the left and right margins of the barplot and subway plot, respectively. This is done with the
plot.marginargument totheme()which organizes the widths as top, right, bottom, left.
Aligning with cowplot
Cowplot’s plot_grid() will fit these two plots together. Originally, I had to export these plots and align them by hand in inkscape, but now, they can be plotted together and aligned in one swoop. There’s some fiddling to be done with the margins, but it might be easier to export it as an svg, and then slide one over to the other in 2 minutes in inkscape.
cowplot::plot_grid(ranges, bars, align = "h", rel_widths = c(2.5, 1))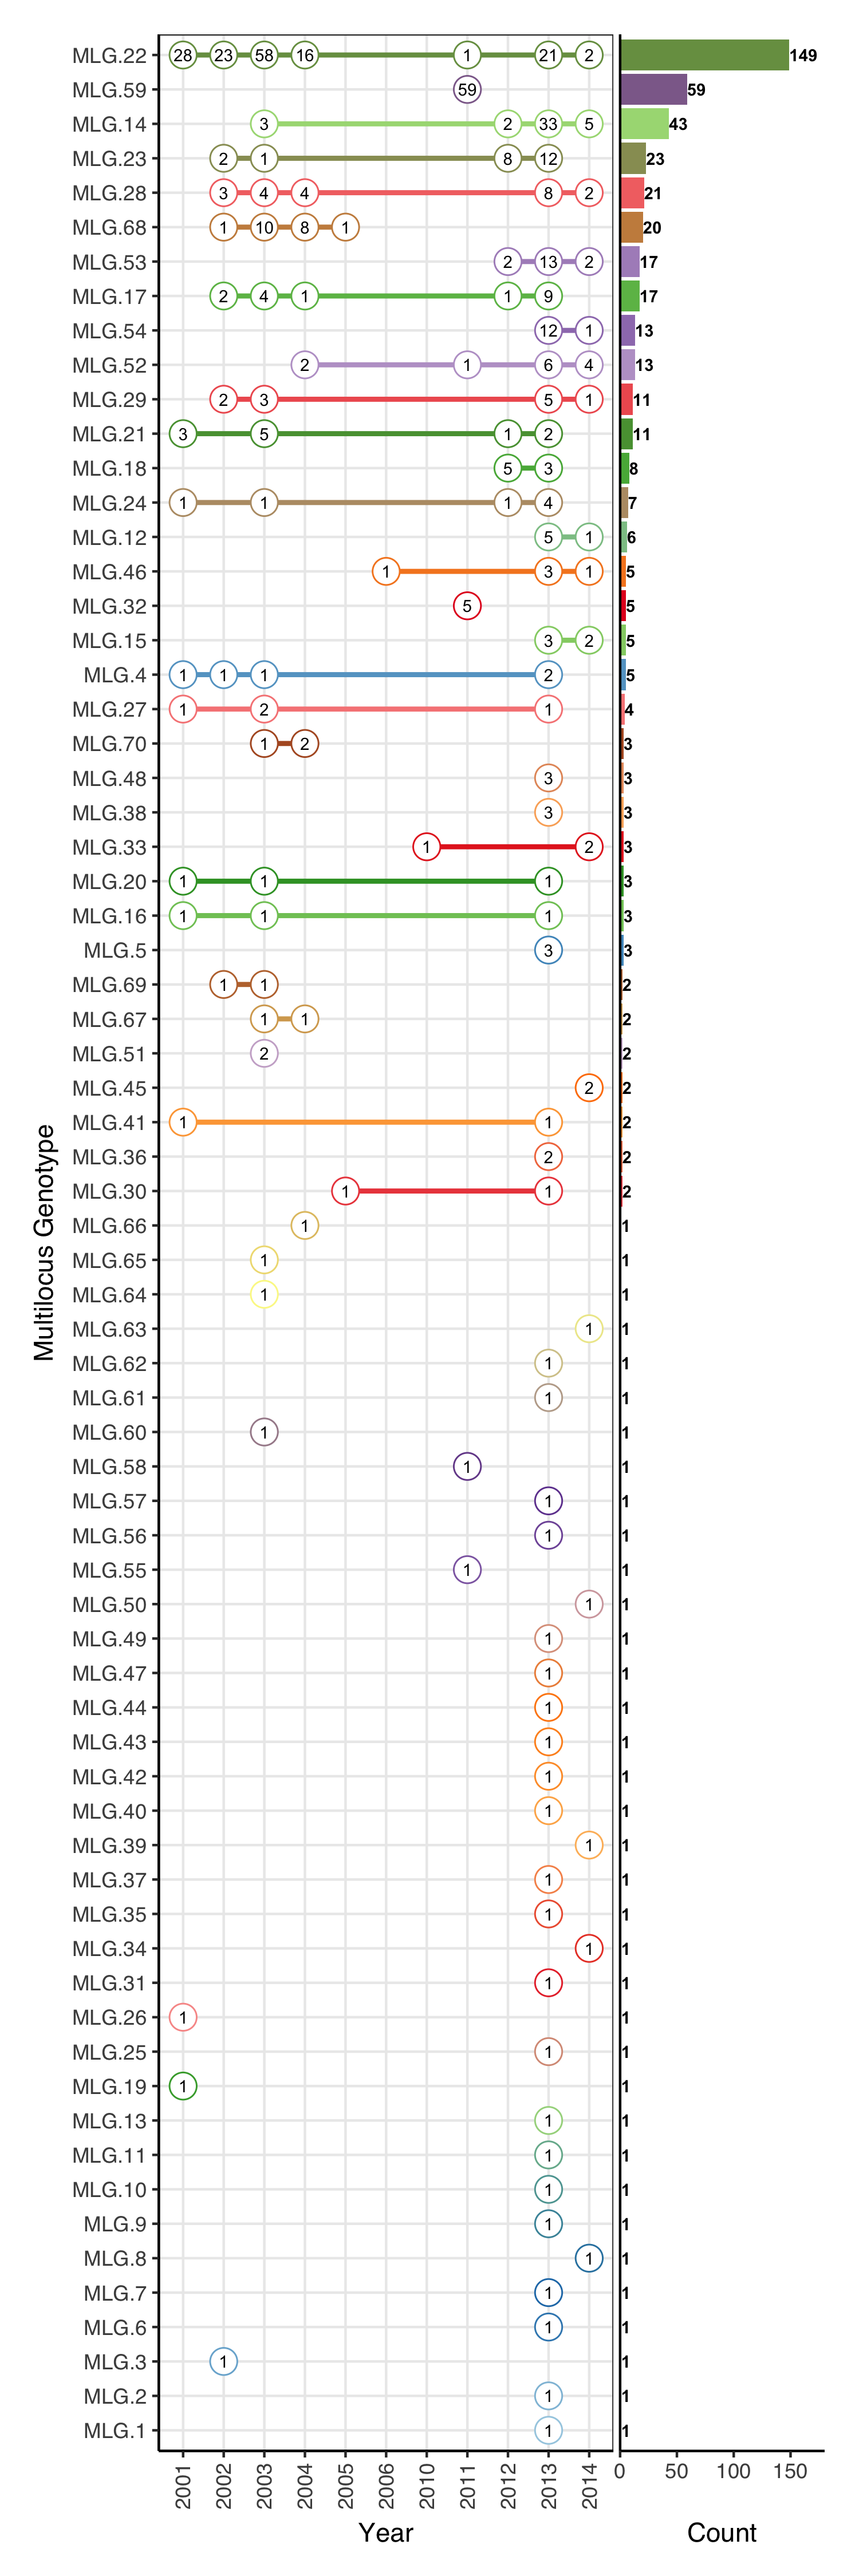
Conclusion
This plot was done when I was originally toying with the idea of keeping my analysis open. Of course, I know more things now than I did then, but I do enjoy the fact that I can go back a year later and recreate the exact plot from start to finish.
Session Information
options(width = 100)
devtools::session_info()
## Session info --------------------------------------------------------------------------------------## setting value
## version R version 3.4.1 (2017-06-30)
## system x86_64, darwin15.6.0
## ui X11
## language (EN)
## collate en_US.UTF-8
## tz America/Chicago
## date 2017-09-17## Packages ------------------------------------------------------------------------------------------## package * version date source
## ade4 * 1.7-8 2017-08-09 cran (@1.7-8)
## adegenet * 2.1.0 2017-09-15 local
## ape 4.1 2017-02-14 CRAN (R 3.4.0)
## assertthat 0.2.0 2017-04-11 CRAN (R 3.4.0)
## backports 1.1.0 2017-05-22 CRAN (R 3.4.0)
## base * 3.4.1 2017-07-07 local
## bindr 0.1 2016-11-13 CRAN (R 3.4.0)
## bindrcpp 0.2 2017-06-17 CRAN (R 3.4.0)
## blogdown 0.1 2017-08-22 CRAN (R 3.4.1)
## bookdown 0.5 2017-08-20 CRAN (R 3.4.1)
## boot 1.3-20 2017-07-30 CRAN (R 3.4.1)
## cluster 2.0.6 2017-03-16 CRAN (R 3.4.0)
## coda 0.19-1 2016-12-08 CRAN (R 3.4.0)
## colorspace 1.3-3 2017-08-16 R-Forge (R 3.4.1)
## compiler 3.4.1 2017-07-07 local
## cowplot * 0.8.0.9000 2017-08-28 Github (wilkelab/cowplot@a0b419e)
## datasets * 3.4.1 2017-07-07 local
## DBI 0.7 2017-06-18 CRAN (R 3.4.0)
## deldir 0.1-14 2017-04-22 CRAN (R 3.4.0)
## devtools 1.13.3 2017-08-02 CRAN (R 3.4.1)
## digest 0.6.12 2017-01-27 CRAN (R 3.4.0)
## dplyr 0.7.3 2017-09-09 CRAN (R 3.4.1)
## evaluate 0.10.1 2017-06-24 CRAN (R 3.4.1)
## expm 0.999-2 2017-03-29 CRAN (R 3.4.0)
## fastmatch 1.1-0 2017-01-28 CRAN (R 3.4.0)
## gdata 2.18.0 2017-06-06 CRAN (R 3.4.0)
## ggplot2 * 2.2.1 2016-12-30 CRAN (R 3.4.0)
## glue 1.1.1 2017-06-21 CRAN (R 3.4.0)
## gmodels 2.16.2 2015-07-22 CRAN (R 3.4.0)
## graphics * 3.4.1 2017-07-07 local
## grDevices * 3.4.1 2017-07-07 local
## grid 3.4.1 2017-07-07 local
## gtable 0.2.0 2016-02-26 CRAN (R 3.4.0)
## gtools 3.5.0 2015-05-29 CRAN (R 3.4.0)
## htmltools 0.3.6 2017-04-28 CRAN (R 3.4.0)
## httpuv 1.3.5 2017-07-04 CRAN (R 3.4.1)
## igraph 1.1.2 2017-07-21 cran (@1.1.2)
## knitr 1.17 2017-08-10 cran (@1.17)
## labeling 0.3 2014-08-23 CRAN (R 3.4.0)
## lattice 0.20-35 2017-03-25 CRAN (R 3.4.0)
## lazyeval 0.2.0 2016-06-12 CRAN (R 3.4.0)
## LearnBayes 2.15 2014-05-29 CRAN (R 3.4.0)
## magrittr 1.5 2014-11-22 CRAN (R 3.4.0)
## MASS 7.3-47 2017-04-21 CRAN (R 3.4.0)
## Matrix 1.2-11 2017-08-16 CRAN (R 3.4.1)
## memoise 1.1.0 2017-04-21 CRAN (R 3.4.0)
## methods * 3.4.1 2017-07-07 local
## mgcv 1.8-20 2017-09-09 CRAN (R 3.4.1)
## mime 0.5 2016-07-07 CRAN (R 3.4.0)
## munsell 0.4.3 2016-02-13 CRAN (R 3.4.0)
## nlme 3.1-131 2017-02-06 CRAN (R 3.4.0)
## parallel 3.4.1 2017-07-07 local
## pegas 0.10 2017-05-03 CRAN (R 3.4.0)
## permute 0.9-4 2016-09-09 CRAN (R 3.4.0)
## phangorn 2.2.0 2017-04-03 CRAN (R 3.4.0)
## pkgconfig 2.0.1 2017-03-21 CRAN (R 3.4.0)
## plyr 1.8.4 2016-06-08 CRAN (R 3.4.0)
## poppr * 2.5.0 2017-09-11 CRAN (R 3.4.1)
## quadprog 1.5-5 2013-04-17 CRAN (R 3.4.0)
## R6 2.2.2 2017-06-17 cran (@2.2.2)
## Rcpp 0.12.12 2017-07-15 cran (@0.12.12)
## reshape2 1.4.2 2016-10-22 CRAN (R 3.4.0)
## rlang 0.1.2 2017-08-09 cran (@0.1.2)
## rmarkdown 1.6 2017-06-15 cran (@1.6)
## rprojroot 1.2 2017-01-16 CRAN (R 3.4.0)
## scales 0.5.0.9000 2017-08-28 Github (hadley/scales@d767915)
## seqinr 3.4-5 2017-08-01 CRAN (R 3.4.1)
## shiny 1.0.5 2017-08-23 cran (@1.0.5)
## sp 1.2-5 2017-06-29 CRAN (R 3.4.1)
## spdep 0.6-15 2017-09-01 CRAN (R 3.4.1)
## splines 3.4.1 2017-07-07 local
## stats * 3.4.1 2017-07-07 local
## stringi 1.1.5 2017-04-07 CRAN (R 3.4.0)
## stringr 1.2.0 2017-02-18 CRAN (R 3.4.0)
## tibble 1.3.4 2017-08-22 cran (@1.3.4)
## tools 3.4.1 2017-07-07 local
## utils * 3.4.1 2017-07-07 local
## vegan 2.4-4 2017-08-24 cran (@2.4-4)
## withr 2.0.0 2017-07-28 CRAN (R 3.4.1)
## xtable 1.8-2 2016-02-05 CRAN (R 3.4.0)
## yaml 2.1.14 2016-11-12 CRAN (R 3.4.0)