20,000 downloads under the C(RAN)
6 min readMy R package poppr hit over 20,000 downloads on CRAN. I thought this would be a nice opportunity to briefly talk about what initiated the development. Before that, let’s look at the cumulative number of downloads:
CRAN you dig it?
Thanks to the fantastic cranlogs package, assessing the download history of a package is quite simple (with the caveat that these are logs from the rstudio mirror, so the value is almost always lower than the true value). Here, I’ve created a graph that shows the cumulative number of downloads over the years, marking the times major, minor, and patch versions became available on CRAN1.
library('cranlogs')
library('ggplot2')
library('ggthemes')
library('lubridate')
library('dplyr')

releases <- tibble::tribble(
  ~version,                        ~date,  ~size,
  "1.0.0",  lubridate::ymd("2013-04-26"),  "2.5M",
  "1.0.1",  lubridate::ymd("2013-07-03"),  "2.5M",
  "1.0.3",  lubridate::ymd("2013-08-21"),  "2.5M",
  "1.0.4",  lubridate::ymd("2013-12-04"),  "2.7M",
  "1.0.5",  lubridate::ymd("2013-12-13"),  "2.4M",
  "1.0.6",  lubridate::ymd("2014-03-05"),  "2.9M",
  "1.1.0",  lubridate::ymd("2014-07-24"),  "1.9M",
  "1.1.1",  lubridate::ymd("2014-07-27"),  "1.9M",
  "1.1.2",  lubridate::ymd("2014-07-29"),  "1.8M",
  "1.1.3",  lubridate::ymd("2015-02-03"),  "1.9M",
  "1.1.4",  lubridate::ymd("2015-02-06"),  "1.9M",
  "1.1.5",  lubridate::ymd("2015-05-13"),  "1.4M",
  "2.0.0",  lubridate::ymd("2015-07-08"),  "2.1M",
  "2.0.1",  lubridate::ymd("2015-07-14"),  "2.1M",
  "2.0.2",  lubridate::ymd("2015-07-18"),  "2.1M",
  "2.1.0",  lubridate::ymd("2015-12-01"),  "2.7M",
  "2.1.1",  lubridate::ymd("2016-03-15"),  "2.7M",
  "2.2.0",  lubridate::ymd("2016-06-13"),  "2.4M",
  "2.2.1",  lubridate::ymd("2016-08-29"),  "3.8M",
  "2.3.0",  lubridate::ymd("2016-11-23"),  "4.0M"
)

cols <- RColorBrewer::brewer.pal(3, "Set1")
releases$type <- with(releases, case_when(
  gsub("(\\d).\\d.\\d", "\\1.0.0", version) == version ~ "major",
  gsub("(\\d.\\d).\\d", "\\1.0", version) == version ~ "minor",
  gsub("(\\d.\\d).\\d", "\\1.0", version) != version ~ "patch"
  ))

x <- cran_downloads(packages = "poppr", from = "2013-04-26", to = "2016-12-28")
x %>%
  mutate(total = cumsum(count)) %>%
  ggplot(aes(y = total, x = date)) +
  geom_line(color = cols[2], size = 1.5) +
  geom_vline(aes(xintercept = date, alpha = type, linetype = type),
             data = releases, color = cols[1]) +
  scale_alpha_discrete(range = c(1, 0.1)) +
  theme_fivethirtyeight() +
  theme(text = element_text(size = 16)) +
  labs(list(title = "Poppr downloads from CRAN",
            alpha = "Release",
            lty = "Release"))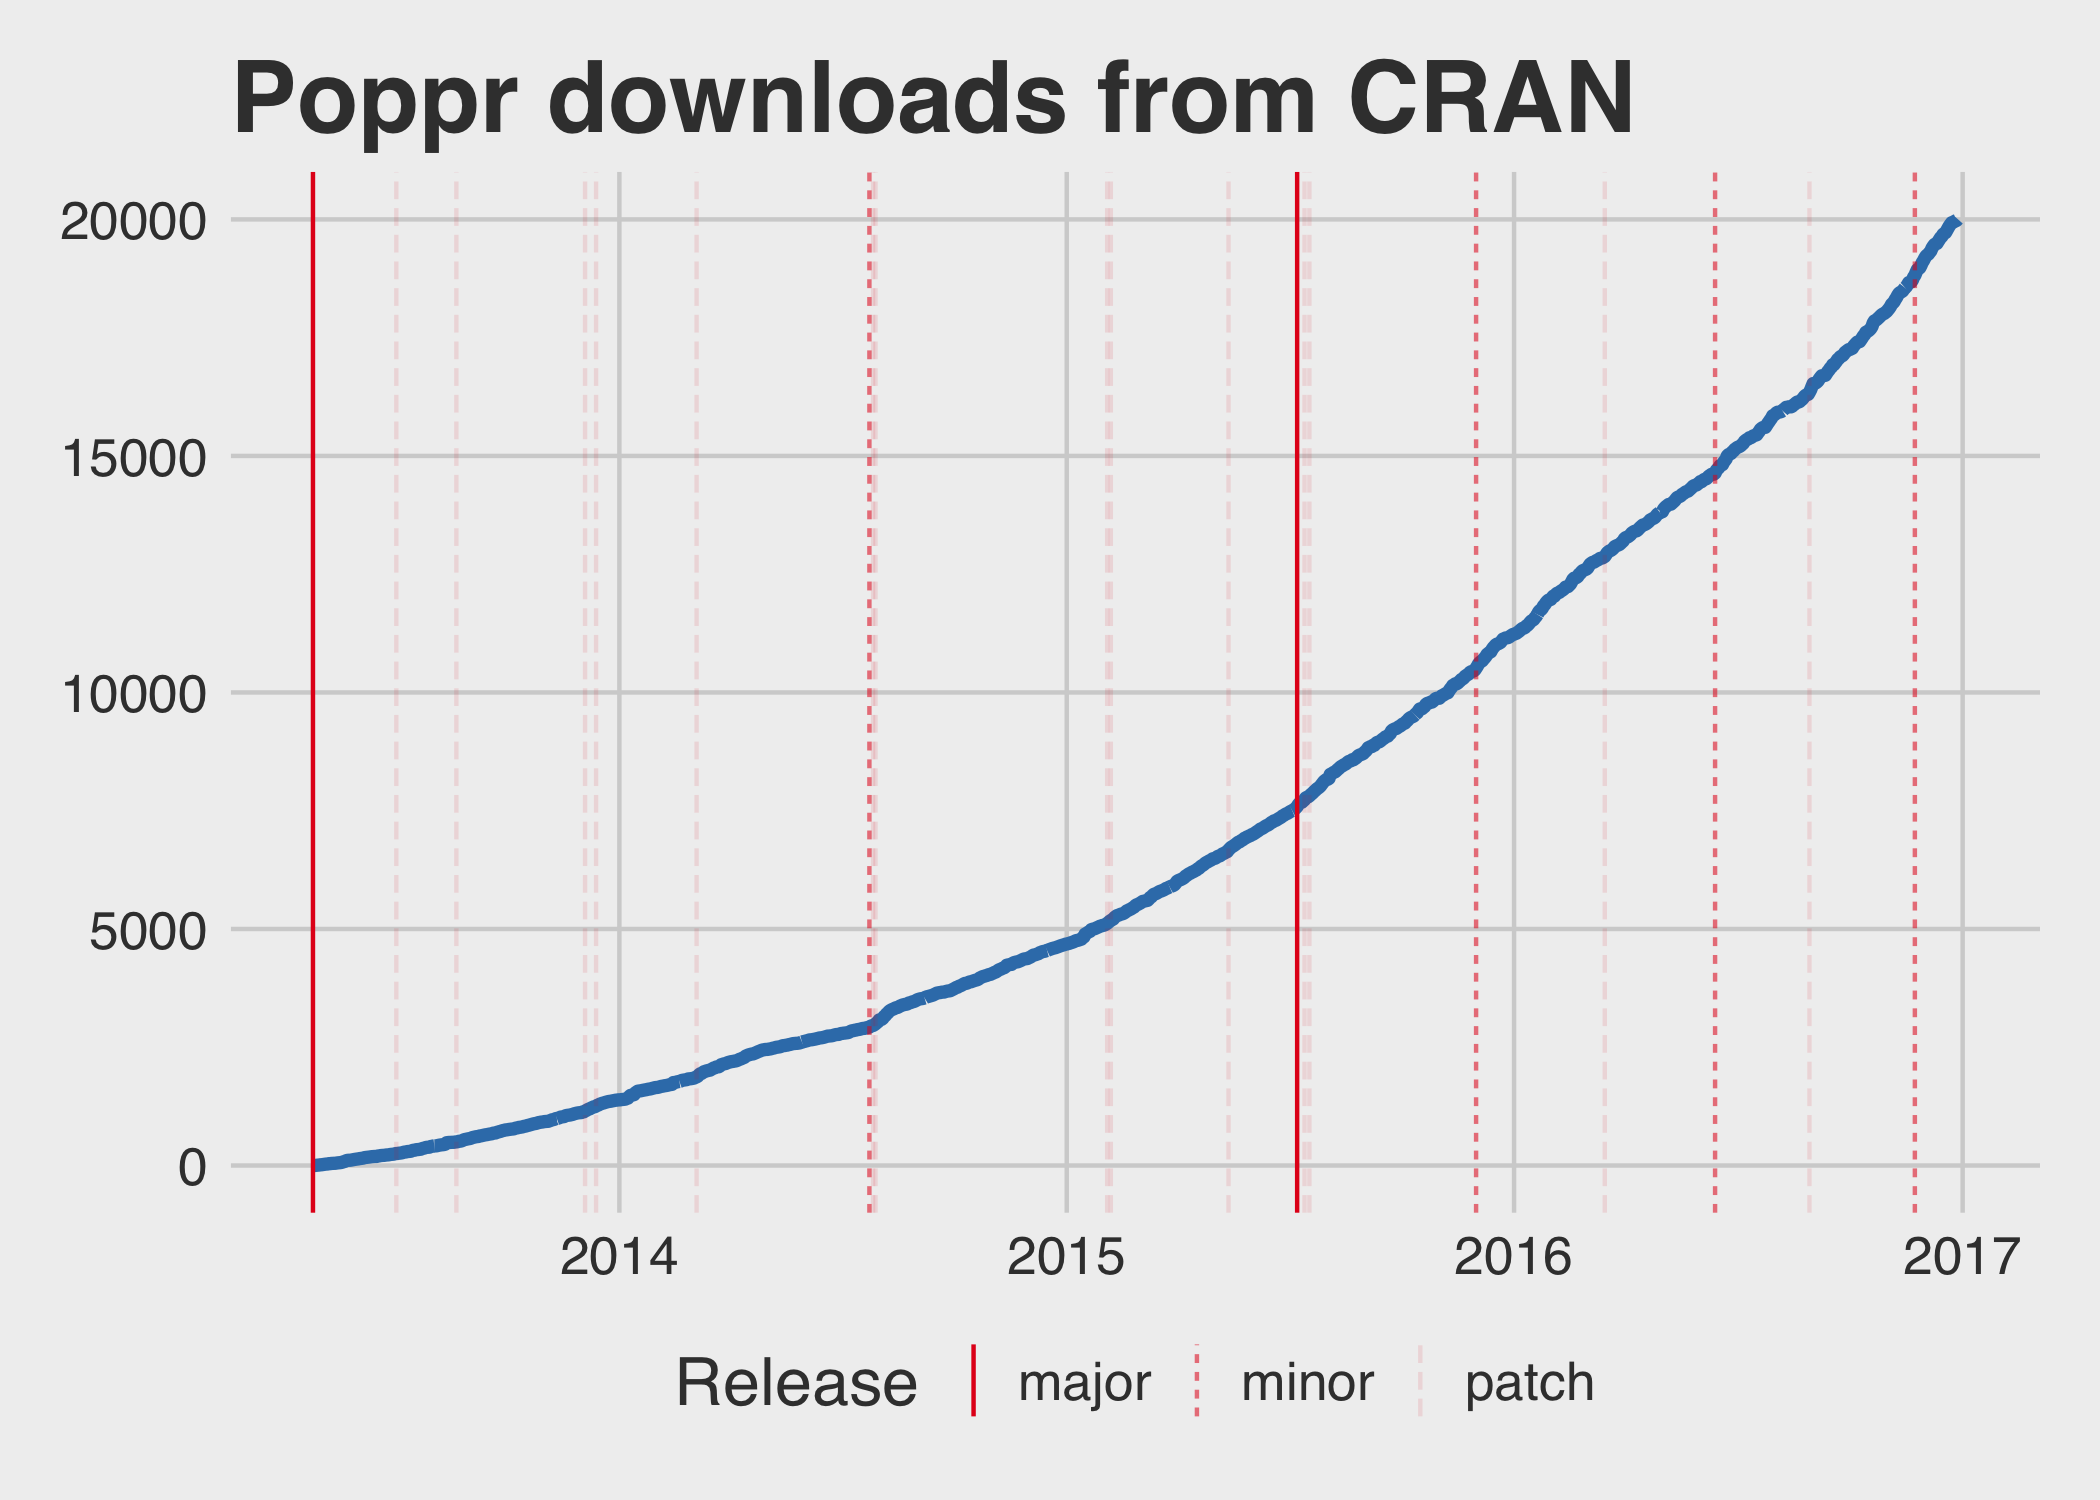
You can see above that I submitted a lot of patch versions early on, and even had to submit some within a few days of each other, but as time went along, I got better at making sensible release schedules. The rate of downloads is obviously increasing over time. How does the number of average daily downloads increase per year?
x %>%
  mutate(year = lubridate::year(date)) %>%
  group_by(year) %>%
  summarize(`Average downloads/day` = mean(count), `Variance` = var(count)) %>%
knitr::kable(digits = 2)| year | Average downloads/day | Variance |
|---|---|---|
| 2013 | 5.55 | 15.36 |
| 2014 | 9.02 | 42.07 |
| 2015 | 17.93 | 104.79 |
| 2016 | 24.19 | 205.74 |
You can see that while the mean is increasing, the variance also increases:
x %>%
  mutate(year = lubridate::year(date)) %>%
  ggplot(aes(x = count)) +
  geom_histogram(binwidth = 5) +
  facet_wrap(~year, ncol = 1, scale = "free_y") +
  theme_fivethirtyeight() +
  ggtitle("Daily poppr downloads by year")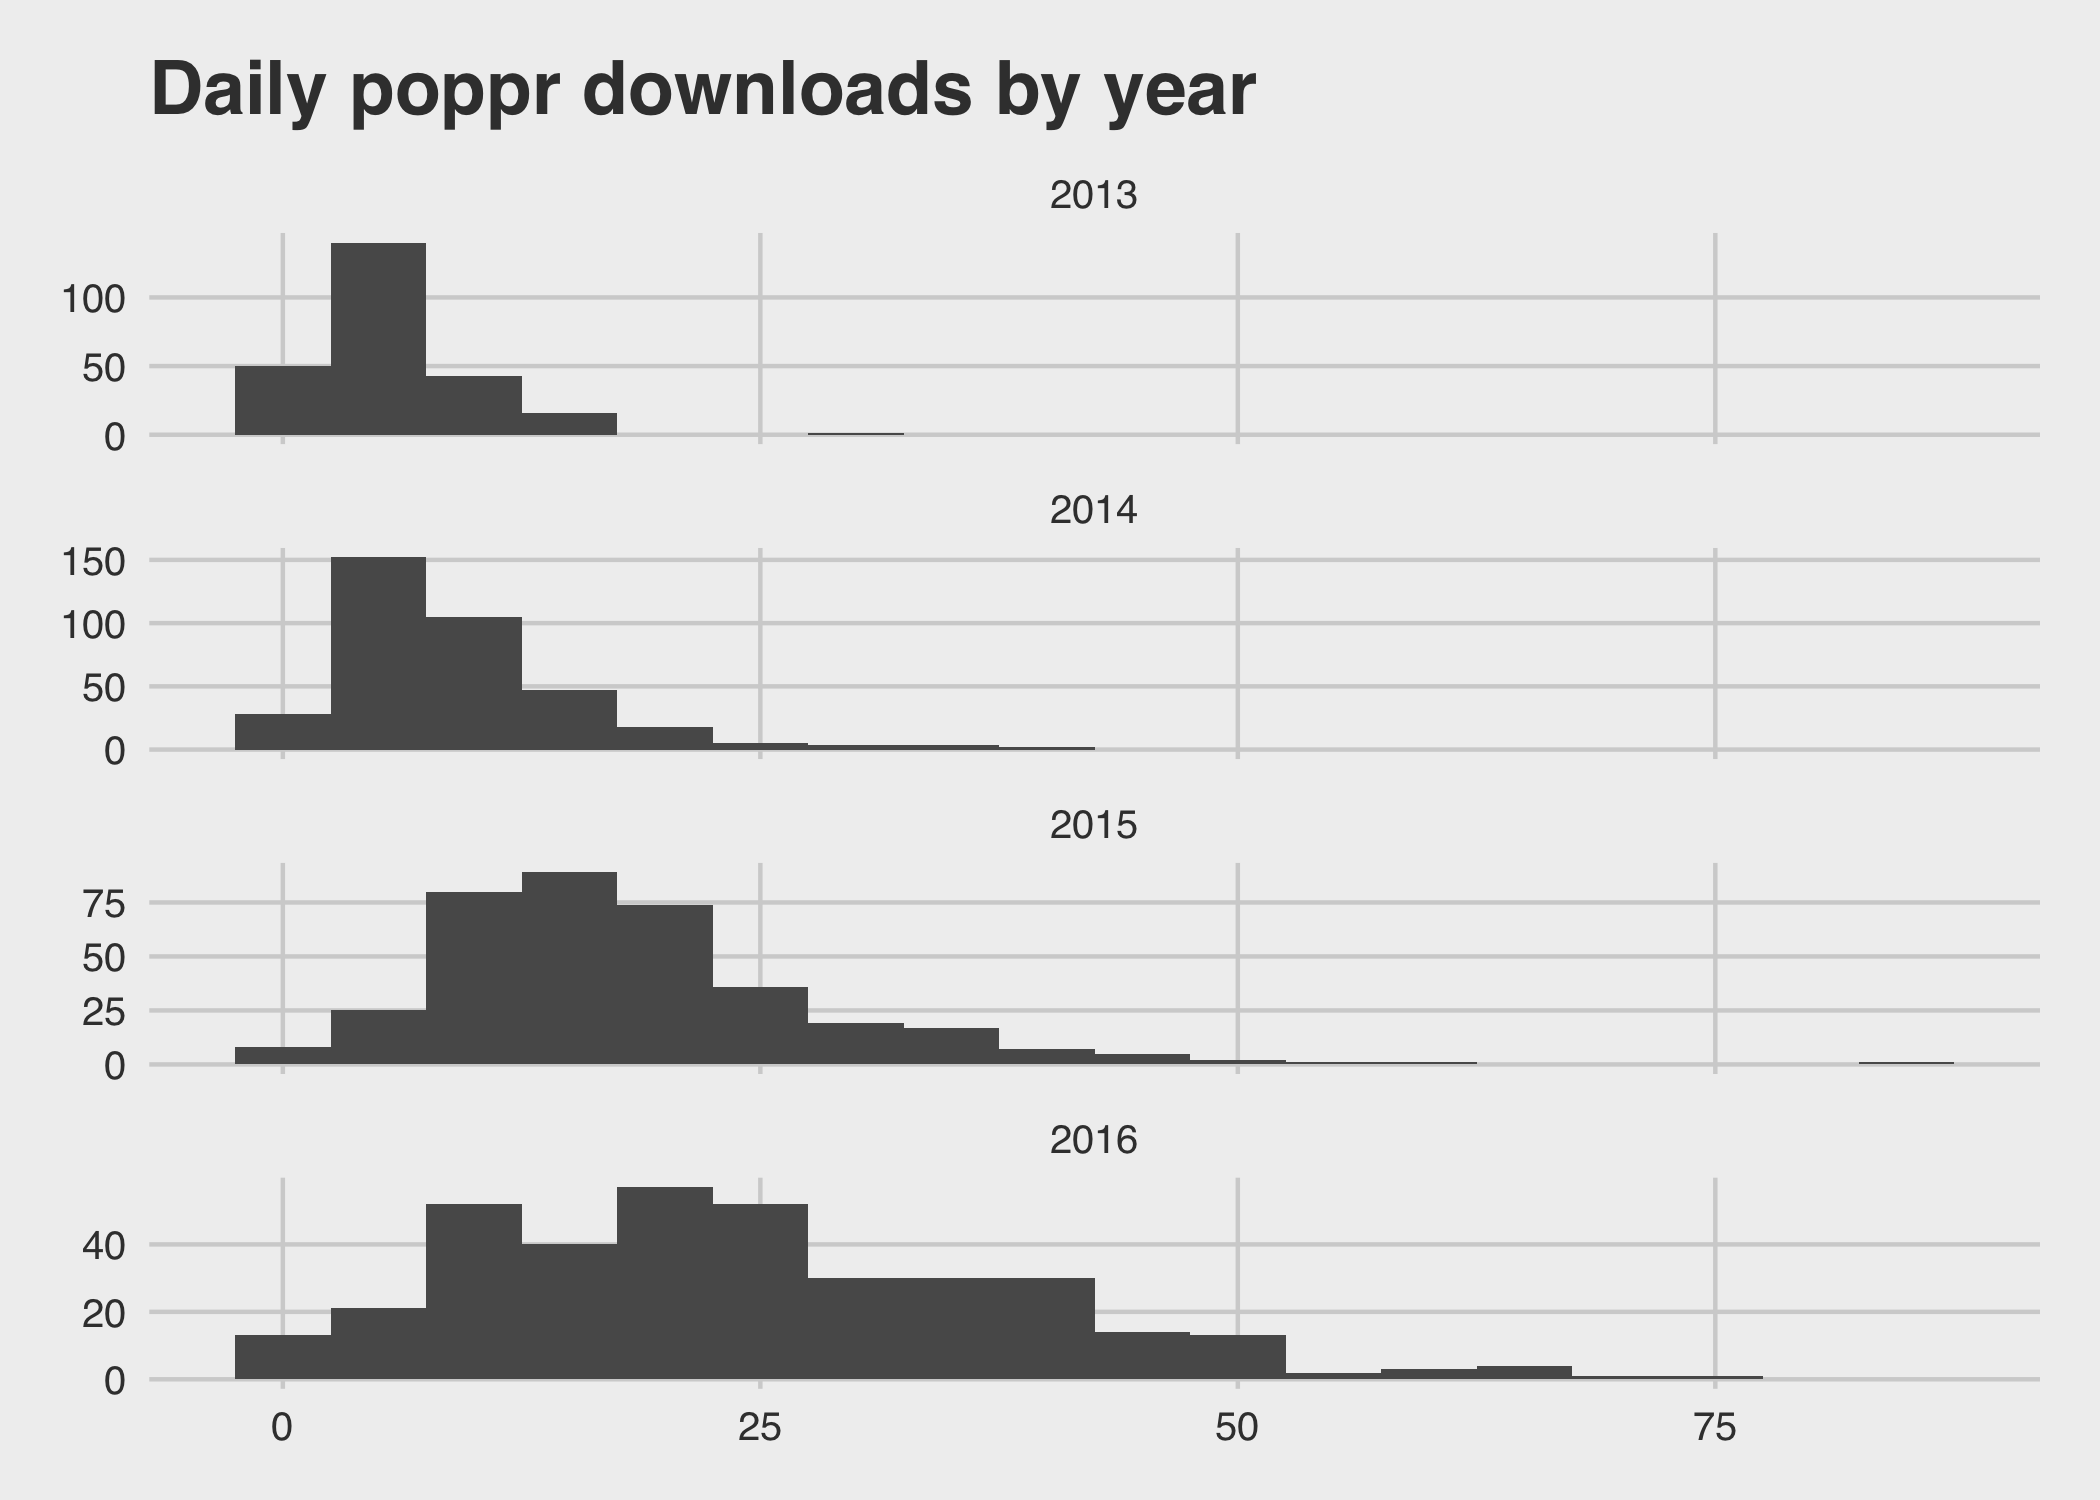
Developing poppr
If someone told me five years ago that my dissertation2 would be centered around an R package I developed, I probably would not have believed them. I was just finishing my first term as a grad student and hadn’t even rotated into the Phytophthora lab. While I had SOME experience in R by way of my stats classes and had taught myself some rudimentary perl and BASH, I was no where near ready to write an R package. Asking me to write an R package was like asking me to build a car… blindfolded… with one arm tied behind my back… at a party.
You get the gist. When I started my rotation in the Phytophthora lab, my first task was to simulate populations of partially-clonal diploids and analyze the standardized index of association to see how it behaved under different population genetic scenarios3. I was able to get the simulations up and running in a couple of months after learning Python, but when it came time to analyze the data, the only program that could calculate the index of association was Multilocus. At the time it was only possible to get this from third-party download sites and it could only run on Windows and OSX platforms. Once you were able to download this and run it, you could only analyze one data set at a time and it was slow4. If I wanted to have any hope of completing this project, I had to find another way. My advisor suggested, “Why don’t you rewrite this analysis in R?” Without knowing any better, I tried it out and spent the next few weeks desperately trying to figure out how to implement the index of association in R.
Eventually, my script worked and then the suggestion came: “You should make an R package out of this.” Serendipitously, Hadley Wickham was teaching an R development masterclass in June of 2012. Before I knew it, I was signed up for the course. After that, I began working on making the package that would eventually become poppr, relying heavily on the code for adegenet for inspiration. I presented a poster for version 0.2 at the 27th Fungal Genetics Conference in March 2013.
While poppr is not the best name in the world, there were far worse suggestions.
After R had officially released version 3.0.0 and the packages poppr depended upon finally were working again, I submitted to CRAN, but I didn’t get there in one try. I got a relatively tame email from Brian Ripley about the vignette and some examples running too long. After that, we made our first submission to a journal.
The first two journals we submitted to rejected us right out (that is, three months after submission), so we revised a third draft and submitted it as a pre-print to PeerJ. After about a month, we got positive reviews with minor revisions, and the paper was published on March 4th, 2014. As of now, according to PeerJ, it has been cited over 100 times.
All in all, poppr came out of being in the right place at the right time when both R and software development were becoming more accessible. It is still in existence because I make sure that it’s use-able and reliable. Tools like devtools, roxygen2, testthat, travis-ci, and git have made the development process so much easier. This, in turn gives me more time to focus on how people will actually use the software, which is important because if software is difficult to use, fewer people will want to use it.
See http://yihui.name/en/2013/06/r-package-versioning/. Major == breaking changes | Minor == new functions | Patch == bug fixes/documentation improvements↩
Here’s a web version in case you don’t want to download the 192 page PDF ^_^ https://zkamvar.github.io/dissertation↩
This project eventually became the fifth chapter in my dissertation https://zkamvar.github.io/dissertation/5-factors-influencing-inference-of-clonality-in-diploid-populations.html↩
The most recent version of the program has sped up considerably and is now open source https://github.com/agapow/multilocus↩